Design
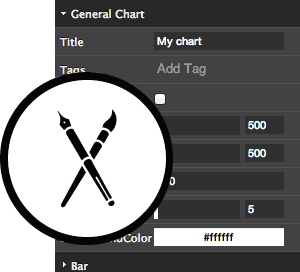
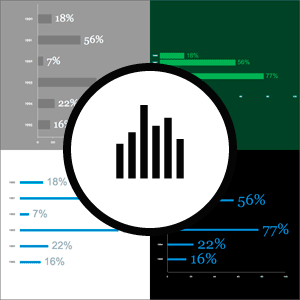
Datavisual makes it easy for you to design the charts and graphs that you want.
Either start with a pre-existing design template from the community gallery or design from scratch.
You can easily change the design without the need to code by using our sliders, color pickers, on/off buttons and text fields.
Data
Once you are happy with your design, simply use our spreadsheet to type in your data, copy and paste it or upload a CSV file.
Output
Once your data has been uploaded you can output your designs as a PNG image, vector PDF, vector SVG or a dynamic web embed.


