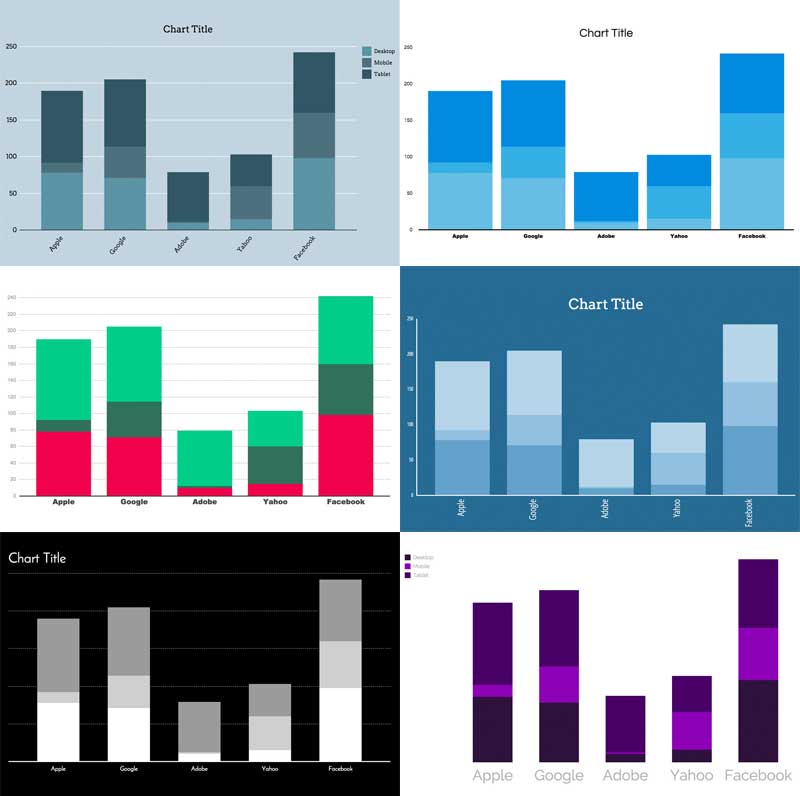
Datavisual makes it easy to create stunning data visualizations. Our intuitive web-based interface offers pre-designed templates that anyone can use while giving design teams the power to rev up workflow and quickly output large volumes of custom data graphics.
Empower Your Team
Managers/Editors
Save time and money
Engage audiences with better quality
Control your brand
Analyst
Remove bottlenecks in your work flow
Create better looking data visualizations
No need for design or development skill
Designers
Powerful design features for precise control
Design once, output unlimited times
Reduce repetitive, low value work
Three Easy Steps
Design
Select from our ever growing number of pre-designed templates or design your own.
Data
Manipulate the data cell by cell or upload your own data file.
Output
Output data visualizations for the web, mobile devices, presentations and print materials.
See what our users have to say.
“Before Datavisual, there was no single tool that everyone in our newsroom could use to make charts and graphs for print and online news stories. Now, I can create a Datavisual chart for a breaking news story in just minutes… it’s fast, easy and requires no programming skills at all. It has been a game-changer for the reporters and editors in our newsroom.”
Kristen Lee, Digital Integration Editor
New York Daily News
“Datavisual gave us real control by making it easy for us to import data, create a style, apply that style to hundreds of charts, and edit and update them quickly. Happy team. Happy client.”
Mark Landry, Principal
Infinia Group
“Presenting the results of analyses in ways that are clear and compelling is no easy matter. Datavisual's easy-to-use software helps all of us do just that.”